Picture of graph of tan(x)
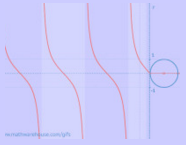
Below is a picture of the graph of y = tan(x). The red dotted lines represent the asymptotes. Symmetry: The graph of y = tan(x) has tranlational symmetry with respect to T(Π, 0).
Below is a picture of the graph of y = tan(x). The red dotted lines represent the asymptotes. Symmetry: The graph of y = tan(x) has tranlational symmetry with respect to T(Π, 0).