3rd Grade Lesson: Fractions and Measuring

screenshot

Discussion/Introduction

Measuring Time! Time to get up, stretch, and have fun with some hands on stuff! Here we look at a combination of measuring—an exciting hands on subject for most gradeschoolers- with a real-life application of fractions. The concepts presented here are simple and your students shouldn’t have much trouble with them, but, done right, they will provide an invaluable intuitive understanding of fractional parts. In fact, this lesson might be considered a foundation stone for future work in three important fields: measurement, fractions, and data representation on line plots.

Objective

Students will learn to use the half and a quarter inch markings on their rulers: to take measurements down to half or quarter inches, to record their data appropriately, and to represent that data on line plots. This will also provide students with a visual representation of what fractions mean in real life.

Supplies

    • Rulers marked with halves and fourths of an inch
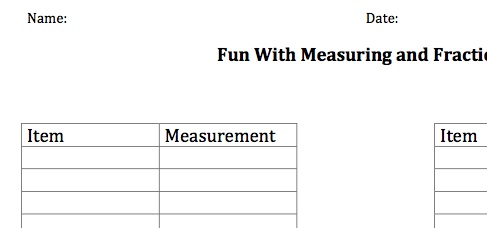
  • Fractions and Measuring Fun Worksheet (download printable)


Methodology/Procedure

Start out by asking your students what they know about fractions. Using their suggestions, make a bullet-list definition/description on the board. If they’re out of ideas, help them. Take time to elucidate any concepts they are hazy on; this is your chance to get everyone started on the same page.

Your list may look something like this:

  • Represent parts of a whole
  • Are written like a/b, when the whole is divided into b sections and there are a of those sections
  • Can be added together if the bottoms [denominators] are the same, by adding the tops [numerators]
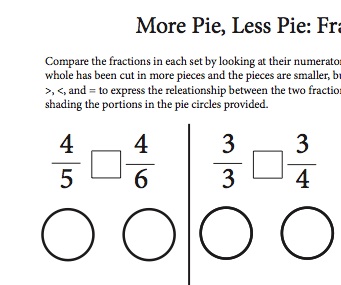
  • A bigger bottom means a smaller amount, a bigger top means a larger amount

Once you’ve gone through what they’ve learned about fractions, tell them that this lesson we aren’t going to learn anything new about fractions. Instead, we get to use what we’ve already learned in a measuring lesson. Ask them to start by getting out their rulers and measuring their middle finger.

They are likely to begin by rounding up or down, so when you get your first data points you’ll want to challenge that and ask them to be more specific. It might go something like this:

Student: My middle finger is 2 inches!

Teacher: Is it exactly 2 inches, or a little more or a little less?

Student: It’s a little less.

Teacher: Do you see some other marks on your ruler? Those are fractions. Today I want us to learn how to measure more exactly, using those fraction markings.

On the board, draw an oversized ruler going from one to three inches. Mark halves and fourths of an inch. Draw an object alongside the ruler; you might make it 1 ½ inches long.

Teacher: This fork I just drew here is a little over one inch long, but if I want to be exact, I have to look at the little markings on the ruler. Since this space (point out the space between 1 and 2) is one inch long, how much is this space? (shade the first half)

A Student: ½!

Teacher: Yes, the shaded area is half of the area between one and two, so this mark here is the half mark. So if my little fork reaches this mark, we say it is one and a half inches long.

Erase your shading, and shade the area between 1 and 1 ¼.

Teacher: Now how much of the area between one and two is shaded?

A student: ¼!

You’re right! So if I have a little tiny pencil that reaches just to here (draw your pencil on the board) it’ll be exactly 1 ¼ inch long.

Follow the same procedure to elucidate 1 ¾. Then draw a number of objects along your chalkboard ruler and get the students to label the lengths.

When they have a good grasp of these chalkboard measurements, go back to the thumb problem and list the middle finger measurements they give you.

When you’ve got the list down, draw a line plot on the board (a number line) and place an x to represent each child’s thumb measurement. This will make it easy to see the clusters. Discuss the graph, and pose a few questions:

  • How many middle fingers are two and a quarter inches long?
  • Are most of the middle fingers in our class the same length?
  • How many middle fingers are longer than [choose a median value]?

Erase the board, draw a second line plot, and have the children measure their pencils, then take turns coming up to he front, noting down their measurement, and filling out an x on the graph.

Now, give your students the worksheet. Ask them to start by measuring all the items in their desk and writing them down on a list. Pencils, erasers, notebooks, textbooks and pencil cases are some of the items that might be measured and recorded. Then, they should fill in the numbers on the line plot and mark it appropriately.

Common Core Standards

This lesson plan is aligned with the Common Core Standards for Mathematics. In Grade 3, Measurement and Data, section 4, the Standards read:

3.MD.4 Generate measurement data by measuring lengths using rulers marked with halves and fourths of an inch. Show the data by making a line plot, where the horizontal scale is marked off in appropriate units— whole numbers, halves, or quarters.

Web Resources/Further Exploration

Math Warehouse is a treasure trove of resources for the math teacher. You’ll find a large bank of high quality free lesson plans, all aligned with the common core, and a variety of helpful tools to make teaching easier.

For instance, to make number lines like those in the worksheet you can use our Number Line Maker : it creates custom number lines as images you can download.

3rd Grade Lesson: Number Names and Fraction Comparisons

Worksheet Snapshot

Worksheet Snapshot

fractioncomparisions_snapshot


Discussion/Introduction

Many 2nd graders and early 3rd graders will consider fractions and whole numbers to be entirely different animals. A fraction is a fraction; a piece of a pie, a portion of a square. A whole number is something other; an indivisible round, an atomic whole.

But third grade is the time when children come to terms with the continuity between fractions and whole numbers. That there are fractions which are simply ‘names’ of whole numbers will surprise some of your students, but it will be a good surprise that can open the doors into future ease in fractional manipulation.

This lesson also builds on the concept of ordering fractions, a topic that is introduced in a previous MathWarehouse lesson. You want your students to become fluent at comparing the landscape of ‘fraction land’. Your aim is that they would be able to tell you on sight which is the greatest of two fractions, given either a similar denominator or a similar numerator.

Objective

That students would be comfortable relating fractions and whole numbers, going from fractions to whole numbers and back again. That they would also gain familiarity in ordering fractions and comparing the sizes of any fractions that have either the same numerator or the same denominator. (3.NF.3.c &d)

Supplies

  • Number Names Worksheet (download printable)
  • Fraction Comparisons Worksheet (download printable)

Methodology/Procedure

Draw a half circle on the board, and ask your student if they can tell you some of its names. If they’ve been exposed to ‘fraction names’ in Mathwarehouse’s Discovering Equivalence lesson plan, they should be able to help you come up with a long list as they mentally divide the circle into more and more segments: ½, 2/4, ¾.

Now draw another circle on the board and shade the whole thing. Ask your students if they know the names of this portion. Write ‘1’, beside the circle, and wait for more suggestions.

If a student comes up with 2/2 for a suggestion, draw the dividing line, tell him he’s right, and put the fraction down on your list. Encourage your students to continue mentally dividing the filled circle to create more fractions. Once you have a long list, ask them how much longer they think it will be. Discuss how it is a list that can go on forever, because you can always divide every portion into smaller and smaller portions. The numbers on the top and bottom of your fractions—always the same—will just keep on getting larger and larger and larger, and there is no end.

Now tell your students you have a very long list of numbers; suggest you put them all on a numberline. Draw a large numberline on the board and write on designations from one to ten, leaving room for continued expansion on the right. Ask for volunteers to come up and write the fractions on the numberline.

This is, in a way, a trick question; because the way the question is set up assumes that the names are separate numbers and will go to different points. If your students are awake and used to thinking through problems rather than parroting answers you should have at least one willing to challenge your statement: pointing out that the list is not a list of numbers, but a list of names of one single number. If anyone makes this objection, ask him or her to get up and demonstrate this to the class. This can be done by dividing the area between 0 and 1 into two portions, and counting down both of them for 2/2; dividing the area into three portions, and counting down all three for 3/3, and so forth.

If no one objects to the graphing of the ‘numbers’ give chalk to three or four volunteers and divide the list up between them, asking them to mark each of those numbers on the number line. They may stare at the board confusedly, they may begin marking the integers they see on the numerators, they may try to do fancy calculations, or they may all dash for the point ‘1’. Give them the time they need to think through the problem and make mistakes, and only call a halt on the project once they tell you they have the numbers all marked. Then, give appropriate feedback: if they’ve marked it correctly, tell them so, and ask them to explain to the rest of the class why all those points are one point. If they have marked the ‘numbers’ on separate points, ask them to demonstrate their ‘orderings’ with pictures.

It is important that you give them the time they need to discover the locations of these ‘cognates of 1’ on the number line, by whatever circuitous route they take. They will learn much more by making mistakes and following through to the dead ends that follow—and then rethinking the problem and finding the right answer—then they would if they were given the correct interpretation straight off. The circuitous, labored path will also cement the final concept in their minds in a way you’d never have been able to teach if you were the prime mover.

When your volunteer discoverers have come to the conclusion that every one of the ‘numbers’ is one, follow up on the concept of equivalence. Ask if these numbers are really one and the same quantity, or if each is just a little bit different. Agree with them that they are all equivalent; all different names of the same absolute point. Each name is just as true and accurate as any other, and no name is bigger or smaller than any other name.


Now you need to extend this to other numbers. Write 2 on the board, draw two circles, fully shaded, and tell your students “This is 2, and this is its name, 2. Does it have any other names?”

If your students have immediate suggestions, begin writing them down, illustrating with dividing lines drawn through your circles to allow any slower students to follow. If there are no suggestions, ask your students what would happen if you divide each circle in half. Allow them to take it from there, and write their list of the ‘names of two’ on the blackboard.

Give each student a copy of the Number Names worksheet, and encourage them to make their list of names for 3 and 4 as long as they can. If they have difficulty keeping track of multiple lines on their strawberry cakes, encourage them to draw their own sets of three or four circles and make the divisions on separate pictures.


This next part of this lesson plan can be taught as a separate lesson if your students go slowly through the whole number section. Remember, going slowly is not necessarily a bad thing; it may mean your students really are taking the time to think things through and really cementing these concepts in their minds.

Write two fractions down on the board: 2/3 and 2/4. Tell your students these are portions of two different regular sized snickers bar at your house, and ask them which is larger.

When they tell you 2/3 is larger, write that down using a > symbol. Ask them how they knew. Bring them to observe that the fewer pieces you divide something in, the larger the pieces are; and a third is larger than a fourth. Note that since the numerators are the same, the denominators will tell which is larger; and the smaller the denominator, the larger the portion.

Ask them how you could check this. One way would be laying the two snicker bar portions side by side. Since the snicker bars are somewhere else and that isn’t possible, you can also check by drawing diagrams, being careful to make neat thirds and quarters. Draw a visual fraction model and shade the areas, demonstrating that 2/3 is larger than 2/4.

Now write 2/3 and 2/4 on the blackboard again. Tell your students that this time, these are not snicker bars, but cakes. After the 2/3, write Mollie’s birthday cake. After the 2/4, write Jennie Brown’s cake. Ask which is larger.

After your students have answered, draw the cakes. Tell them Mollie’s cake is a 12” square. Tell them Jennie Brown’s cake is a three layer wedding cake, with a radius of 22”. Ask them if their answer is still right .

Ask them what went wrong in their thinking; or why the method they used for comparing parts of snicker bars didn’t work for comparing parts of cake. Bring them to observe that you can only compare fractions if they refer to identical wholes.

Let them know, though, that when they see fractions without designation in math problems, they may assume they are referring to identical wholes unless told differently. In story problems, though, they’ll need to be careful.

Now write 2/4 and ¾ on the board, and tell your students these fractions refer to snickers bars again. Ask which is larger. When they tell you ¾ is larger, draw the < symbol between the fractions. Ask how they knew. Bring them to observe that if the denominators are the same, the fraction with the larger number in the numerator is larger. This is because the identical denominator means the pieces are the same size, and the larger numerator means you have more pieces.

Ask them how they could check this: with a picture. Draw the picture, demonstrating that ¾ is a larger piece.

Now write ½ and 2/4 on the blackboard. Ask which is larger. Observe this is more difficult to compare by looking at the numbers because neither the numerator or denominator are the same, but ask them if they can rename ½ into something else. Suggest they draw a diagram of ½, and divide each portion in half again to find the ‘new name’. When they rename ½ as 2/4, the denominators become the same so that they can be compared easily: in fact,  the two fractions are both 2/4, exactly the same.

Give your students the fraction comparisons worksheet, and ask them to fill it out. They’ll be asked to use the symbols >,<, and = when they compare fractions, and they’ll also be asked to justify their conclusions with a simple circle diagram, a visual fraction model.

Common Core Standards

This lesson is aligned to 3.NF.3 c & d in the Common Core State Standards for Mathematics.  3.NF.3 reads, in part:

c.  Express whole numbers as fractions, and recognize fractions that are equivalent to whole numbers. Examples: Express 3 in the form 3 = 3/1; recognize that 6/1 = 6; locate 4/4 and 1 at the same point of a number line diagram.

d. Compare two fractions with the same numerator or the same denominator by reasoning about their size. Recognize that comparisons are valid only when the two fractions refer to the same whole. Record the results of comparisons with the symbols >, =, or <, and justify the conclusions, e.g., by using a visual fraction model.

Web Resources/Further Exploration

This is only the beginning: your students need to cement their understanding of ordering and comparing fractions by doing lots of games and exercises. Take advantage of everything Mathwarehouse has to offer–all free— by visiting http://www.mathwarehouse.com/fractions/ and also looking through our lists of free lesson plans.

3rd Grade Lesson Plan: Discovering Equivalence

Ordering flashcards

Ordering flashcards

Discussion/Introduction

What does it mean when a fraction is the same as another, and what does it mean when it is different? Is 2/4 really the same as ½? Although your students have discovered informally that the slab of pie represented by those two fractions— and the point on the number line—looks, feels, and acts the same, they still need to take this one step further and realize that these two fractions are actually one and the same quantity.

This 3rd grade lesson plan will give students the tools they need to understand  the concepts of same and different  applied to fractions. Through visual ordering exercises your students will become adept at recognizing fractions that are the same, and by the end of today’s session they should be able to make up their own simple lists of equivalent fractions.

Fractions and Ordering: Discovering Equivalence

It’s important that you introduce this topic with real world, dynamic, easily understandable examples rather than with mathematical equations and manipulations. Your students aren’t ready, right now, to grasp that 2/4 is ½ because they can divide 2 out of both sides of that first fraction. That is for later. Introduced with fancy manipulation, fractions become a complicated numerical puzzle that will leave many of your students feeling confused and helpless. When demonstrated with visual examples, though, equivalent fractions will speedily seem intuitive to your students; nothing less than common sense.

Objective

Students will understand that two fractions are equivalent if they are the same size, or the same point on a number line. They will be able to explain why fractions are equivalent, and will be able to recognize and make up lists of simple equivalent fractions.

Supplies

  • Folding paper, 1 square per student.
  • Flashcard sets; one per student (download printables)
  • 2 scrabble tile holders

Methodology/Procedure

As a warmup, begin with a quick fractions review. Pass out the folding paper, and have your students fold fractions—as fast as possible; first one done is the winner—as you call them out. Call out ½, 1/3, ¼, 1/6, and 1/8, in random order.

If they have difficulty, continue this exercise for several rounds. When they achieve fluency, tell them you are proud. Tell them you’ve got a fun topic to look at today; and it’s a topic you won’t even need to teach; they can discover it all themselves.   Give each student a partial set of fraction number & visual flashcards; ½, ¼, 2/4, and ¾ cards from both visual and numerical sets. Ask them to match the cards to the pie pictures, and then to order both sets according to size, smallest to largest.

When they have finished, walk around the room and review the students’ work. Help any who have had trouble, encouraging them to look at the picture cards and compare relative sizes. Find two students who have chosen different orderings, and give them the scrabble tile holders. Ask them to place their numerical cards carefully on the tile holder, then go to the front of the room and display their ordering to the class. Observe that these are two different orderings of the same set; ask which is wrong.

Invite any students who point out one or the other as wrong to explain why it is wrong, using the picture flashcards and comparing sizes.

If your students say unanimously that neither is wrong, tell them that they are right. Draw on the board the visual circle fractions, and demonstrate how the two parts are exactly the same.

Tell them that in math the two fractions ½ and 2/4 are called equivalent fractions. Explain that what that means is that they are two names for the same thing. Sometimes one name is more useful, sometimes the other is. Ask them if they know anyone who has two names. If they do not come up with their own examples, remind them of a common acquaintance—the principal, perhaps, who is called Mr. Brown at school, Daddy at home, and Jake by his golfing friends. Point out that the man these names this refers to is the same, no matter what name he is called, and that all of these names belong to him equally.

You can also use yourself as an example.

Draw a half circle on the chalkboard, and tell your students this could be labeled as ½ or 2/4, and both answers would be entirely correct. Ask them if they can think of any other names for this same portion.

If any students have suggestions, invite them to come up and demonstrate equivalence on the board with pictures. If no-one has any idea, use lines to divide the circle on the board into eight equal wedges, and point out that half is also four 1/8 wedges, or 4/8.

Ask your students how many names each portion has. Let them think about and discuss this, and then demonstrate how each portion will have an infinite number of names, because you can always divide the existing pieces each in half again to get twice the amount of smaller pieces.

Hand out the remaining card sets, and ask the students to match the number cards to the visual cards and then order all the cards by portion size, from smallest to largest. Suggest they show equivalence by placing equivalent fractions at the same level in their orderings.

Let your students take their times over their orderings. If they finish quickly and you have time left before the end of the class, do some quiz work: draw shaded portions on the blackboard and ask your students to help you come up with a list of possible ‘names’.

Common Core Standards

This lesson is aligned to standard 3.NF.3 in the Common Core State Standards for Mathematics; 3rd Grade Numbers and Fractions item 3.  3.NF.3 reads, in part:

3.NF. 3. Explain equivalence of fractions in special cases, and compare fractions by reasoning about their size.

a. Understand two fractions as equivalent (equal) if they are the same size, or the same point on a number line.

b. Recognize and generate simple equivalent fractions, e.g., 1/2 = 2/4, 4/6 = 2/3. Explain why the fractions are equivalent, e.g., by using a visual fraction model.

Web Resources/Further Exploration

The beautiful flashcards  your students used in this lesson are made with the help of Mathwarehouse’s nifty Visual Fraction applet. This applet is a really fun way to generate classroom graphics, and also an enjoyable way for students who might be having difficulty visualizing fractions to see pizza portions generated before their eyes as they type in the fractions they are curious about.


adobe_pdf-116x150

Download this Lesson and Printables including Fraction Flash Cards


Hopscotch Fractions: Third Grade Lesson Plan

faction-name-tag_lesson_prop

Fraction Name Tag


Discussion/Introduction

This lesson plan is meant to follow another; 3rd Grade Fractions on the Number line. These lessons are both aligned to Common Core Standard 3.NF.2. Here I’ll assume you’ve gone through that first lesson, and that your students are comfortable marking off intervals to show 1/b on the number line.

In your last lesson your students will have stayed in their chairs during most of the class period, working hard on dividing up fraction intervals and coming to terms with the idea that 1/b on a number line means portioning the interval between 0 and 1 into b parts and then, starting at zero, marking off one of these parts. Today you get to cement that concept a bit more by taking the next step up: your students will discover that a/b means that, starting at 0, you mentally hop a ‘1/b’ size steps toward 1.

That’s all they need to learn today, but you want them to know it backwards, forwards, and inside-out. Since there’s no better way to get to that point than with a fun de-stressing game, you’ll do this by getting your students up out of their chairs  for a rousing game of ‘hopscotch fractions’. Games have a way bringing book learning from the ‘theoretical’ category into ‘real life’, and this one is no exception.

Objective

That students would be comfortable representing a fraction a/b on a number line diagram by marking off a lengths 1/b from zero, and that they’d understand that the resulting interval has size a/b, and that its endpoint locates the number a/b on the number line.

Supplies

  • Large 0-2 number lines, laminated and taped to the floor (ideal length: 3 or 4 feet long). These can also be prepared by taping standard printing paper end to end and drawing the number lines with markers, using rulers for uniformity. You’ll need one for every four students.
  • Strips of colored paper the same size as one unit on the number line; one per student; four colors.
  • A marker for each student; four colors; each student’s marker must be coordinated with his paper.
  • Fraction Nametags (download printable)
  • Hopscotch Flashcards (download printable; print 1 per page)
  • Three types of stickers (ideally, small stars in red, yellow, or green; but other simple colored stickers can substitute).

Methodology/Procedure

Begin by reviewing what you taught in the last lesson. Remind the students that we talked about what fractions of abstract numbers mean, and we learned that they work in exactly the same way as fractions of tangible, concrete things like apples. Draw your 0-2 number line on the board, mark 0, 1, and 2, and ask how you would find out where to mark 1/3. After listening to their suggestions, take a  strip of paper the size of a unit on your number line, divide it in thirds, and use that to mark 1/3.

Then ask your students how you’d mark 2/3. Give them permission to discuss it with their neighbors, then ask for a volunteer to come and demonstrate it on the board. He will most likely demonstrate it correctly; laying your 1/3 strip end to end twice to find the 2/3 point.

If he doesn’t, or if the idea still seem counterintuitive to many of your students, go back to the idea of distance. Get a volunteer to come stand beside you and then walk three steps away. Ask him to come one third of the distance back (1 step). Then ask him to go back, and tell him now to come two thirds of the distance to you. Continue with other volunteers and other fractions until your students are comfortable with the idea.

Then transfer this idea onto your number line, and show how starting at zero and measuring two 1/3rds brings you to the 2/3 point on your number line.

Then have the children help you move tables and chairs to the back, so that you have a large empty space to work. If a gym or other large empty room is available, you may want to move there for the rest of this class. Otherwise, tailor the size of your number lines to match the available space.

Set up the number lines on the floor. Each number line will have four children manning it, so you’ll need to have as many number lines as the number of children in your class divided by four. These number lines will preferably be arranged side by side, in a line.

Assign the students to teams; four students to each number line. Give each student a strip of colored paper the size of one unit on their floor number lines. Then assign each student a fraction: in every group, you need a 1/3 student, a ¼ student, a 1/6 student, and a 1/8 student. Tape the designations on each student’s shirt. For a ‘handicapped race’ effect, give 1/3 and ¼ designations to the slower students, 1/6 and 1/8 designations to those that are faster. Each student will be called on the same number of times, but students with smaller fractions will have to do more counting and hopping.

Hand out the number strips and markers; in each group, one of each color. It helps organization if you give all students representing a particular fraction the same color.

If you have one odd student out, make him the caller. If you have two or three odd ones out, give them a number line and fractions.

Ask the students to mark where their fractions are on their number lines: 1/3, ¼, 1/6, and 1/8. They will do this with the strips of paper, folding them into appropriate sections as they did in yesterday’s lesson, and using those sections as rulers. Tell them to keep these strips of paper folded after they’ve used them. These strips are their ‘shoes’, and they’ll be needed again and again throughout the game.

Describe the game to them. The caller (you, if there wasn’t an extra student) stands at the front of the room with a pile of full-sized shuffled ‘hopscotch flashcards’. He picks one, displays it, and reads it out. Immediately the students representing that fraction take their ‘shoe’ – the paper strip—mark off the appropriate number of intervals, and then jump, once in each interval, to the fraction marker. For instance, if the caller picked “4/6” the 1/6 player would measure off 4 ‘1/6’ measures with his paper shoe, and then, as soon as they are measured, hop down to the fourth one, doing a one foot jump in each place. The first three to successfully measure and jump are awarded stickers on their fraction nametags: red for the first to hop to place, yellow for the second, and green for the third. Then they go back to the beginning, and the caller calls again.

They will soon discover that after they’ve been called once future calls are easier, as they will have marked off some (maybe all) of their fractions on the number line.  Since they are using their colored markers, it will be easy to tell their intervals versus their team-mates. Before the game is halfway done, you should have no measuring at all; just quick, sure hopping when a new fraction is called.

Throughout the game, continue to interweave your class objectives with the game by asking at intervals, randomly, but of every student at least once: How far did you jump? (a steps) What was the size of the interval you jumped through (a/b)? Where is the point a/b on the number line (at the end of a 1/b steps).

Play as long as time permits; the game speeds up as you go, so you should be able to get through the stack of flashcards twice. At the end of the game the stars get tallied up on a per team basis: red is three points, yellow two points, green one point. The team with the greatest number of points wins.

Common Core Standards

This lesson plan is aligned to the Common Core Standard 3.NF.2.  That item reads, in part:

3.NF.2. (b). Represent a fraction a/b on a number line diagram by marking off a lengths 1/b from 0. Recognize that the resulting interval has size a/b and that its endpoint locates the number a/b on the number line.

Web Resources/Further Exploration

This lesson plan gives you  one fun way of making fractions come alive, but it’s best to approach every topic from multiple angles. That’s why I’m recommending Mathwarehouse’s wonderful fraction resources again— after all, they’re all free!

adobe_pdf-116x150

Download Lesson Plan


3rd Grade Lesson Plan: Fractions on the Number Line

Where do fractions go on a numberline?

Where do fractions go on a numberline?

Discussion/Introduction

Up to this point fractions have simply been discrete portions of tangible wholes; real parts that can be felt, seen, and tested. This third grade lesson plan, though, marks a water shed: we get to transfer our knowledge of ‘half a cookie’ to the more abstract concept of half a unit on a number line.


Objective

That students would be able to represent a fraction 1/b on a number line by defining the interval from 0 to 1 as the whole and partitioning it into b equal parts, and that they’d understand that each part has size 1/b . Also, that they would understand that the endpoint of the part based at 0 locates the number 1/b on the number line.

Supplies

  • Number line experiment worksheet for each student (download here)
  • Precut (colored) strips of paper, ½-1 inch thick and the length of zero to one on the student’s number lines, and a few longer strips of paper for you to use with the number line you will draw on the blackboard
  • Apple or other similar easily dividable item

Methodology/Procedure

Tell your students that they’ve become so good at identifying and dealing with fractions—portions of pie, pizza, or apples and oranges—that today they can take what they’ve learned to a whole new sphere.

Pick up an apple. Tell them that it is an apple; you can feel it, you can measure it with a ruler, and you can divide it into two equal parts with a sharp knife. Remind them you can do the same with pizza, and with almost any physical object, provided your knife is sharp enough.

Then ask them if there are other things they could divide in half, things they can’t touch, feel, or cut with a sharp knife.

Write a list of ideas on the blackboard. Some ideas might be groups of things (or people), air, water, time, or space.

Validate each addition to the list as you write it down, and then tell them that today you’re going to look at fractions of three special things: portions of time, space, and mathematical units.

Talk about time first. Ask what it means when we say ‘half an hour’, and get as many versions of the answer as possible. If no-one suggests it, tell them that one way of thinking about it is as half the distance from one hour to the other.

Draw a diagram of your day on the blackboard; essentially, a number line that describes your day. At this point, though, don’t describe it as a ‘number line’ to your students.   Put sitting up in bed, the first thing you do in the morning, away on the far left side of your diagram. Put going to sleep as the last thing, and in the middle put lunch.

Tell your students that the area between waking up and lunch is your morning; and then shade the first half, and tell them it is half your morning. If the morning was four hours long, from eight to twelve, and you were feeling miserable half the morning, ask them how long you were feeling miserable. (2 hours) How long were you feeling okay? (Also 2)

Observe that if you look at time in that way, time is very similar to distance. Talk about the distance between the bed and the lunch table in your drawing, and what half of it means. Talk about half of the way from the place you are standing to the window. Walk four steps away from your desk, counting as you go, and ask how many steps it is to your desk. Ask how many steps you would need to walk if you wanted to walk only half the way back to the desk (2). What if you wanted to walk just a quarter of the way back? (1)

Now erase everything from the blackboard and draw a simple number line going from zero to three. Ask them what this is called (a number line). Remind them that since a number line is math, we can use it to mean anything. We get to use the same number line, in exactly the same way, whether we’re talking about cookies, pizza, time, or distance.

Tell them for now you’ll pretend it’s talking about pizza. Put your chalk at zero, write a small dot, and test the students on basic number line usage: Here, you see, I have no pizza. If I buy two pizzas—one peperoni and one sausage—where would I show that on the number line?

Your students should guide you to move your hand to the two. Do so, make a dot there, and then go back to the zero.

That was the day before yesterday, explain. Yesterday, I also started with no pizza. I also bought pizza. But I wasn’t feeling very hungry and didn’t have much spare money, so I only bought half. How can I show that on the number line? There isn’t any place that says ‘half’.

Listen to any ideas they come up to. If someone suggests dividing the portion of the number line between zero and one in two parts and making a dot on the middle line, tell him you really like that idea.

Take a strip of paper exactly as long as the distance between zero and one; fold it in half, lay it on the number line from 0 to ½, and draw your ‘half pizza’ dot. Shade the area on the line between 0 and ½. Ask your students how long that segment is; compared to the length between 0 and 1 (1/2 the length). Ask them where the segment starts (0).

Pick up the folded paper strip again, and ask how long it is (1/2 of what it used to be). Since it is ½, ask them if it means ½ wherever you place it on the number line—do you have to begin measuring off at zero, or can you start somewhere else instead? Get feedback as to why or why not before you explain that since ½ is just half of one, and you have no ‘wholes’ to add it to, you always have to start on zero when you measure its placement.

Ask them how you’d find out where to place a do for 1/4th. Fold your strip into fourths, and use the folded strip as a measuring stick to place a dot at exactly 1/4th.

Ask about 1/3, unfold your strip and refold into thirds, and prepare to make a 1/3 mark. Ask where you should start the strip when you measure off the 1/3 (at 0).

Ask which mark is closer to the zero (1/4); which is furthest away (1/2).

Then pass out the student worksheets and strips of paper. Your students will be marking ½, 1/3, ¼ and 1/6 on their own number lines. If you have not introduced 1/6th previously, you may need to walk your student through that fraction by marking your own 1/6 on the blackboard.

Common Core Standards

Under 3.NF.2, the Common Core State Standards for Mathematics reads:

3.NF.2 Understand a fraction as a number on the number line; represent fractions on a number line diagram.

  1. Represent a fraction 1/b on a number line diagram by defining the interval from 0 to 1 as the whole and partitioning it into b equal parts. Recognize that each part has size 1/b and that the endpoint of the part based at 0 locates the number 1/b on the number line.

Web Resources/Further Exploration

Here are some links to helpful web resources that might help your students learn to enjoy fractions. When they’ve decided that fractions are definitely fun, it’ll be easy to gain  the familiarity and intuitive understanding they need to make a success of classroom work.


Third Grade Fractions Lesson Plan: Learning Notation


Fractions are a secret code

Fractions are a secret code

Discussion/Introduction

Third graders have a magnetic relationship to secret codes. Anything to do with secret writing, dangerous espionage and top-secret missions brings up the energy in the room several points. Fractions tend not to have that same magnetic appeal. In fact, 1/b notation can look so strange to third graders that the first sight of a page filled with the stuff makes them want to turn their brains off.

If it’s taught wrong, that is to say. Taught right, though, with just the right amount of fun mixed in, third grade fractions can be just as exciting as a top-secret mission in dangerous territory with a good dose of secret codes mixed in.
Download lesson
My free lesson plan, aligned with the Common Core (3.NF.1), is a slightly nontraditional but completely fun look at fractions for third graders. There’s no reason to make fractions dry book learning; let them be a game, a ‘break from the hard stuff’.

Objective

That students would gain familiarity with fractions and learn basic fractional notation: that 1/b is the quantity formed by 1 part when a whole is partitioned into b equal parts and that a/b is the quantity formed by a parts of size 1/b. That they would learn to work as a team, helping the weakest members in order to gain united success.

Supplies

  • 1 piece colored folding paper for each student, or construction paper rectangles
  • Five flashcards for each student: ½, ¼, ¾, 1/3, 2/3 portions of a circle (printable here)
  • One set of large flashcards for teacher, with ½, ¼, ¾, 1/3 2/3 written out.
  • ‘Initial Assignment’ missive paper, one copy of each (printable here)
  • Secret missive paper, enough for the class; two types (printables here and here)
  • Group prizes or ‘winning team’ paper headbands, enough for half the class.
  • Math notebooks or writing paper & pencils for each student.

Methodology/Procedure

Tell your students that you’re not going to do much regular math today; today is going to be a fun day. Go on to explain that instead of doing regular arithmetic and adding or dividing (or whatever yesterday’s topic was) you’re going to learn something really cool: a secret code that they’ll be able to use to write important math messages with. And that if they learn it well, they’ll be able to use it right away, in an exciting game that they can play in the classroom.

But tell them that before you start that, you’d like to do a brief review of fractions. Ask them what a half is (one of two equal parts) and how many halves are in a whole (2). Ask what a third is (one of three equal parts) and how many thirds are in a whole (3); then go on to fourths. If they have forgotten any of this or it seems even a little rusty, give them a bit of a refresher. Give them each a rectangle and as you call out ‘half!’ ‘quarter!’ or ‘third!’ have them race to fold it and display the portion you called.

When they’ve got it, tell them they have, and tell them you’re proud of the speed with which they can fold. Tell them now they’ve done their work, so now it’s time to go on to secret codes and the new game.

Ask them what they know about secret codes. Give them a chance to talk about what they know; the final thought you want to come up with—and you can just state it yourself if no-one has similar thoughts—is that a secret code is a way of giving information to one’s friends in a way that one’s enemies can’t understand.

Tell them that another special thing about secret codes is that they’re often short and concise, allowing their writers to put a lot of information in a very little space. Then tell them that now you are going to show them how to write fractions in secret codes.

Draw a circle, and color half. Then, next to it, write ‘half’ on the blackboard. Tell them this is how you write half in plain English. Ask them if it’s easy to read and understand (yes). Ask them if it’s short. (Not too long, but it takes the space of four whole letters).

Ask them how they would make a secret code that would express half.

Encourage them to experiment with different possibilities in their math notebooks. After a few minutes, ask whoever has an idea to come forward and draw it on the blackboard. Provide chalk for each child, and have them write down their secret codes.   Ask whoever has a unique notation to explain their secret code and why they chose it to the class.

Then tell them that there are people called mathematicians who decided what the main secret code was going to be for math, and you’ll tell them that secret. Write ½ on the blackboard, next to the word half.

Ask them why they think the mathematicians chose that way. After they’ve had a chance to express their ideas, show them how they can read it as ‘one of two equal parts’, and that the number on the bottom is the number of parts you’ve divided the whole in; the top, the number of those pieces you have.

Ask them to copy ½ down into their math notebook. Then draw another circle on the blackboard, divide in four quarters, color one quarter, and write the word ‘quarter’ next to it. Tell them this is a quarter, and this word is how you write quarter in English. Ask them whether they have any guesses as to how you would write it in math’s secret code.

If you have any volunteers, have them come up to the blackboard try out their ideas, and explain them to the class. Validate each idea, and if anyone writes ¼, tell him that he was thinking in exactly the same way as the mathematicians were. Write ¼ next to your word ‘quarter’.

Go through the same procedure for 1/3rd; here, thought should be united enough that you should be able to call just one confident child up to the blackboard to write down 1/3 as his idea and explain how he got it.

Now draw another circle on the blackboard; divide it into thirds, but instead of shading 1/3 , shade 2/3. Write “two thirds” and ask your students how they’d write it in math secret code.

Ask volunteers to come up and share their ideas with the class. If you get 2 1/3, tell the writer that it is a good idea, but the problem is it looks the same as the way you’d write two wholes and a one third, and draw a picture of that with circles.

When someone comes up with 2/3, tell him he was thinking just like he mathematicians who decided this code.

Pass out the flashcards, and tell the students that when you display your secret code flashcard you want them to pick up and show you the equivalent pie flashcard, without looking at any of their classmates. Go through your cards in random order at least twice; more if some students are having difficulty.

Then tell them it is time for the game. Divide the class in two teams, each with a team leader who has a good grasp of what you’ve been teaching. Tell them that the team that wins will get whatever prize you’ve prepared, or get the honor of wearing ‘winning team’ headbands for the rest of the week in school.

Tell them that when soldiers or intelligence agents use secret codes in war, it is very important that every member of the team is able to do his part well and convey the message without losing any of the meaning. Ask what happens if one of the people passing on a message forgets the secret code (the message is lost). Tell the teams that the same thing will happen if one of their members musses up or forgets the code: they will lose all chance of winning.

Give them five minutes to review the secret code together, and tell the leaders they are responsible for making sure every member of the team understands how to write and decipher the secret code of fractions.

When they are ready, set each team up as a chain. The game will be conducted like telephone; you’ll give the leader of each team a picture with six circles, each divided into different fractions with different parts shaded. They’ll ‘translate this’ on to their missive sheet, writing in math’s secret codes. Then they’ll fold this paper up and pass it to the next team member, who will take it, color and shade the circles on his paper, and pass that paper on to the next team member

Teamplayers will have been given circle and secret missive papers, alternately. You may want to walk up and down the lines checking the work; your responsibility is not to make sure they are doing it correctly, but just that the ‘secret code’ writers are not writing circles and the circle drawers are not writing code.

The first team which sends the message down the line correctly wins. When the message goes down the line, you pick it up and return it to the first player. He compares it with the original paper you gave him. If they are the same, they have won. If they are not correct and the other team has not yet won, he can walk down his line, checking the papers, and find where the mistake began. If he corrects that mistake, the message begins again at that person and is passed on again down the line until it comes to the end.

To avoid bad feelings and loser mentality, you can let the other team continue working till they’ve got the message passed down correctly also, and offer them a consolation prize or ‘silver medal finalists’ headbands.

Tell your students they have learned something incredibly useful today; a secret code with which they can communicate with other math people all over the world.

Don’t forget to encourage them to practice this special code  any chance they get. One way of doing this would be by spending some time on our fun fractions activity pages.  Visual Fractions is a simple but very enjoyable interactive web application where students can type in any fraction and see it formed before their eyes. The link Online Fraction Games  will bring your students to a number of other fraction-based games; some a little above their level, but others that they are ready to tackle.


Download Lesson
adobe_pdf-116x150

Common Core Standards

In 3.NF.1, the Common Core State Standards for Mathematics reads:

3.NF.1 Understand a fraction 1/b as the quantity formed by 1 part when a whole is partitioned into b equal parts; understand a fraction a/b as the quantity formed by a parts of size 1/b.

3rd Grade Pie Chart Lesson Plan

.

Favorite Colors in the Classroom

Discussion/Introduction

Download Lesson

Our graphing units in third grade used to be focused primarily on circle graphs (pie charts), but under the Common Core, bar charts are given a new prominence. Bar charts are intuitively easy to understand for second and third graders, and since they build on and are closely connected to the number line, they follow logically from the other math your students are doing.

But just because bar charts are taking center stage , doesn’t mean we can stop teaching pie charts altogether. While bar charts make comparing the relative size of parts a simple visual exercise, pie charts offer intuitively obvious visual comparisons between parts and the whole. Teaching circle graphs also enables our students to practice fractions in a fun, easy-to-grasp way.

This lesson plan focuses on gaining a visual understanding of whole-part relationships through the use of a simple circle graph, and also gives students an opportunity to practice fractions , as required by section 3.NF.3 (Number and Operations—Fractions) in the Common Core. “Explain equivalence of fractions in special cases, and compare fractions by reasoning about their size.”

Objective

To understand a pie chart (circle graph) and to be able to deduce information about the relative size of the parts shown in it. To be able to compare fractions by reasoning about their size (Common Core 3.NF.3)

Supplies

  • A graph printout from http://www.meta-chart.com/pie, a free pie chart maker
  • Paper cutouts: a large circle cut out of thick white paper, and ½, ¼, and \(  frac{1}{8} \) sectors of circles cut out of different colors of construction paper.
  • Paper and markers/crayons/colored pencils for each student

Methodology/Procedure

Start with a review of fractions. Show the students your white circle, and ask what they think of when they see it. Give them some time to discuss what a circle means to them, and validate their feelings and opinions as they share them. These opinions can be as simple as ‘pizza!’ or as abstruse as ‘unending’; there is no one answer. When they have all had a chance to share how they feel about it, explain that to you, since it is a whole, entire circle, it can mean a ‘whole’ of anything—a whole class of children, a whole country, a whole family, a whole bag of skittles.

Cover half of your circle up with your ½ circle construction paper cut out, and ask how much of the circle is colored now. After the students have answered, tell them that since the whole circle meant to you a whole of anything – a whole class, a whole country, a whole bag of skittles—the colored sections mean, to you, half of anything. Half a bag of skittles, half a class, half a country.

Ask half the class to hold up their hands; the front half, the back half, or the side half. Then tell them that you could use this circle to show how many children had their hands up; the colored section would be the children with their hands up, and the white section would be the other children.

Take off the half circle of construction paper and replace it by the ¼. Ask your students if they know how much of the circle is shaded now. They will probably be ready with the right answer; if anyone is unsure, show that ¼ is half of a half, and that four quarters cover the whole circle. Ask a quarter of the class to raise their hands; you will probably have to mark off the demarcation lines for the quarter. Tell them that if the whole white circle represents the class, that construction paper quarter is the part of the class with their hands up.

Go on to \( frac{1}{8}\), introducing it the same way with your \( frac{1}{8}\) construction paper sector.

Now show the students the graph printout from http://www.meta-chart.com/share/favorite-colors-in-the-classroom and tell them it is a graph which shows the favorite colors in a class of students like yours. Tell them it is called a pie chart, and ask them if they know why.

Favorite Colors in the Classroom

Ask which color is the biggest favorite. Then ask which of the three explicitly listed colors the least amount of children seem like.

Now tell them the class was made up of twenty students, and ask them how many students liked blue. Ask whether fewer or more than six students have green for their favorite color, and whether or not five students have purple for a favorite color. Ask if four students might have purple for a favorite color, and then whether two might have liked purple best.

Now take a poll of favorite colors in your classroom, and put the data on your blackboard. It may look something like this:

  • Blue – Zack, Katie, Markus, Peter–4
  • Green – Jamie, Paul, Christian-3
  • Red – Jordan-1
  • Pink—Mallory, Katie, Jennifer, Desiree, Madeline-5
  • Purple – Desiree -1
  • Yellow—Sofia, Edwin -2

Tell your students you want them each to make a pie graph for you, using this data. Suggest they group the smaller amounts together under ‘other’; in the example above, this would be red, purple and yellow, totaling four. Then start with the color most children like, and ask what fraction of the total number of children like that color. In the example above this would be \( frac{5}{16}\). Help the students relate this to the fractions you’ve already discussed; in this case; just a little more than \( frac{4}{16} = frac{1}{4} \). Have the students color a generous quarter on their circles, and go on to the next color: in this graph, blue, \( frac{4}{16} \) or exactly \(frac{1}{4} \) of a circle.

At this point you don’t want to focus on the nitty gritty—for instance, it would be counterproductive to divide your circle into sixteen, twenty, or thirty equal portions—as many portions as you have students in your class—and make an exact circle graph by coloring in the appropriate number of sectors. Instead, you want to focus on getting an intuitive sense of the size of different fractions. Your students will  do this by relating the fractions they are unsure of—how much is \(frac{5}{16}\), anyway? to what they already know. In this case \( frac{4}{16} = frac{1}{4} \) which is a nice solid quarter, and the \(frac{1}{16}\) it goes over is less than \(frac{1}{8}\), which is a fat sliver.

When your students have all created their own graphs have them take turns explaining what they drew and what different sectors mean. Ask them which color is favorite, which is second favorite, which is third favorite. Ask them how the graphs would change if one child changed his favorite color– for instance, if Madeline decided she preferred blue or Jordan switched to green. Then ask them what would happen to the graph if your class was merged with another third grade class of the same size, and all the children in that class liked yellow best.

These exercises should give your students a new familiarity with and perspective on fractions, as well as  opening the doors to understanding data representation with pie charts.


Common Core Standards

This lesson plan is aligned to Standard 3.NF.3 (Third Grade Numbers and Operations– Fractions, item 3 ) in the Common Core. 3.NF.3 reads: “Explain equivalence of fractions in special cases, and compare fractions by reasoning about their size.”

3rd Grade Bar Chart Lesson Plan


Discussion/Introduction

Download lesson at bottom

In third grade we get to liven up our bar chart lessons by taking advantage of our students’ new familiarity with multiplication and division. By the end of third grade, the Common Core recommends that students know from memory all products of two one digit numbers. By the time you schedule your bar chart lesson, your students should be comfortable doing skip counting by twos, threes, fives or tens; and that means they shouldn’t have any difficulty interpreting a scaled bar chart.
.

Calves, Baby Camels and a Scaled Bar Chart Lesson

Objective

In this 3rd grade bar chart lesson, students will learn to analyze and understand data presented on a scaled bar chart. They will learn how to do both simple and multi-step comparing problems using the bar chart.

Supplies

• Graph printout from www.meta-chart.com/bar/ , or, if your classroom has projector capabilities, a graph prepared and saved on your laptop.
• One sheet of graphing paper for display, with large squares and a height of about ten squares
• Graphing paper and markers for each student

Methodology/Procedure

Start this lesson with a bit of storytelling. Math and imaginative thinking go well together, and starting a new math topic with an imaginative exercise means you’ll have the attention not only of your technically minded, mathy children but also of those who love their English but usually ‘turn off’ when they come into your classroom.

Once upon a time, far away, in the wild open steppe land of Mongolia, two children lived with their old grandfather and grandmother in a little round tent made of felt. Their little tent was alone on the steppeland; for as far as they could see to the east, west, north and south there was nothing but waving grasses and wooded hills. That, and the camels, yaks, sheep and horses which made up the family wealth.

It was Temuujin’s job to take the horses and yaks to pasture every morning, and Zolzaya, his little sister, took the sheep and goats to the green grass on the other side of the hill. Grandma and Grandpa were getting old, and though they still hobbled around, checked everything, and told the two children what to do, they were past the age for active work.

Then came the spring when Grandpa’s legs were so bad he could not make his rounds of the herds as he had used to. He had to stay in his bed by the fire, and the furthest he could move was to his seat by the fire. He worried about his herds, and though Temuujin and Zolzaya knew everything was going well, he wouldn’t believe them when they told him that. He would ask questions about numbers—how many more kids are there than lambs?—and numbers were not Temuujin’s strong point. When Temuujin was uncertain in answering, he would get angry and say that the boy knew nothing about taking care of animals.

One day Temuujin and Zolzaya decided to do something special to give their grandfather all the information he wanted about the animals. They would count all the lambs, kids, foals, calves and baby camels, and mark down the numbers in a tally chart. Then they would make a bar graph for their grandfather, so he could see exactly how many animals he had without having to go outdoors. They knew that with a bar graph they could solve any comparing problems he asked them just with one glance at the paper.

They were quite sure that this would make their grandfather very, very, happy, and they had exactly one sheet of graph paper to draw their bar graph on.

But when they came in from counting, both Temuujin and Zolzaya had very somber faces. This is what their numbers looked like.

Lambs: 37
Kids: 42
Foals: 11
Calves: 15
Baby Camels: 6

And this is what their graph paper looked like:

Display a simple sheet of large-squared graph paper , with ten squares each way.

How could they put their data on this little sheet? The numbers were too big.

Stop here, and give your students a chance to discuss the problem. After a discussion break, ask for possible solutions.

Temuujin and Zolzaya realized there was only one thing to do: they could scale their bar graph so that each block on the graph paper, instead of meaning 1 animal, meant five. This made some of their numbers very easy to work with. The calves, for instance, being exactly fifteen, would be represented by a bar exactly three squares tall on the bar graph.

What about the baby camels? How could they make a bar that meant ‘six’, if each square stood for five?

Stop again for discussion. Ask any students who have solutions to share them with the class.

Temuujin realized that he would have to divide the square up, in his mind, into five equal slices, and let the camel bar go exactly one \( frac{1}{5}  \)  slice over into a second square.

So this is what Temuujin and Zolzaya’s graph looked like.

Display your printout of http://www.meta-chart.com/share/baby-animals-on-the-steppe, or put it on the projector.

bar-chart-lesson-plan-image

They were very pleased when it was done, and carried it proudly in to their grandfather. And after that, they could answer all his questions with just a moment’s hesitation, whenever he asked them about the numbers of animals.

Before you go into these questions, the initial data you put on the blackboard should be erased, so that students are encouraged to base their arithmetic on the graph rather than on the raw numbers.

The first question he asked was, how many more kids are there than lambs?

Let your students decide how to solve this and the following problems, and come in with your ideas only after they have it worked out. If they get stuck, they should be encouraged to see that there is a difference between lambs and kids of just one square, so five animals.

The second question was—how many foals and baby camels are there, altogether?

If your students decide to do this problem as \(   5 cdot 2 + 5cdot  frac{1}{5} + 5cdot 1 +5 cdot frac{1}{5}  \) , tell them they are right—and then point out that they can also do it as \( (2 frac{1}{5}+1 frac{1}{5})5\); or, if they prefer dealing with whole numbers and fractions separately, \( 5(2+1) + frac{(1+1)}{5} cdot 5. \)

The third question was—how many baby animals are there altogether?

After your students have worked on this problem, show them that one easy way would be to add the whole numbers—7+8+2+3+1=21, add that to the sum of the fractions \((frac{2}{5}+frac{2}{5}+frac{1}{5} +frac{1}{5}) = frac{6}{5} =1 frac{1}{5}\), and multiply both by five: \( 21 cdot 5 + frac{6}{5}) cdot 5= 105+6=111\).

Grandpa’s last question—how many fewer foals are there than kids?

This can be done as \( (8-2) cdot 5; + (frac{2}{5}-frac{1}{5}) cdot 5.\)

Extension Exercise

If there is still time before the end of the lesson, ask the students if they can make a scaled bar graph to let Grandpa know how many horses, cows, and camels there are:
Horses-20
Camels -11
Cows – 18

I’ve found that students respond wonderfully to the use of stories in the math classroom, and sometimes a touch of faraway places and novel situations can make an otherwise ‘booooriing!’ math exercise almost magically fun.

adobe_pdf-116x150 Download This lesson as a pdf

Common Core Standards

The specific section on bar charts in the 3rd grade Common Core Standards for Mathematics reads: “Draw a scaled picture graph and a scaled bar graph to represent a data set with several categories. Solve one- and two-step ‘how many more’ and ‘how many less’ problems using information presented in scaled bar graphs” [3.MD.2]. Since our students need to be familiar with reading and interpreting scaled bar charts before they can draw them independently, my scaled bar chart lesson plan, given above, focuses primarily on interpretation and problem solving. Students will also be involved in thinking through the creation of a scaled bar chart and can go on to draw their own charts in an extension exercise if time permits.