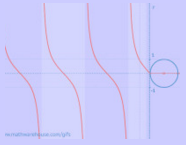
So what does a log graph look like?
There are two main 'shapes' that a logarithmic graph takes. Depending on whether b in the equation $$ y= log_b (x) $$ is less than 1 or greater than 1.

Note: The two pictures up above do not include the case of b = 1.
Can you figure out why? What is special about the graph of $$ y = log_1 (x) $$?


